The dislocation in gold and silver (and …

The dislocation in gold and silver (and oil) are definitely the market story of the day, and everybody I talk to today wants to analyze why. Here’s an expanded and more detailed version of the post I did about why I started shorting gold and silver earlier this week. I’ll be back later with more on what to do with our gold and silver shorts now:
Time to start shorting the precious metals? Back in early 2007, I used to write about the “dislocations” that were suddenly showing up with more frequency as I was worried and started selling partly because the stock market was seemingly entering a blow-off top phase. By dislocations, I meant any day that the market moved more than 2% intraday, because those types of intraday moves dislocate a lot of both bulls and bears as they gyrate and chase the stocks up and down throughout the day. The stock markets soon topped out after those dislocations starting appearing with frequency.
On the other hand, there was a streak in 2005 and 2006 where the stock market had more than 100 trading days without a 1% intraday move. That was a time of bull market rally. I used to call it a “Steady Betty” market, and it’s one of the most bullish set ups you can have an investor. And it’s not just for “technical analysis” (chart reading) reasons that such “Steady Betty” action is so bullish, but the concept of steady economic and market times means builds on itself over time as businesses and traders get more confident in the steady action and feel like they have some sense of “normalcy”.
Indeed, it’s the “velocity” of the moves rather than the moves themselves that matter sometimes — a steadily declining dollar losing half its value over many years as has been the case in this country is painful for savers and domestic small businesses, but it’s not nearly as painful as an overnight 30% decline in the dollar would be. A sudden, mass-recognition if the sham of real estate property values at the top crashed our entire financial sector and forced trillions of dollars of taxpayer funds into bailouts.
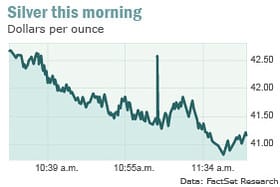
I bring all this up in today’s Revolution Investing newsletter because silver has now had a full 10% intraday swing for the second time in two weeks. Here’s this morning’s chart:
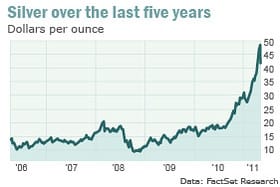
Dislocations anybody? I’ve been waiting patiently for gold and silver to start their ugly topping process on what I believe could be a blow-off top for their prices that is exhausting itself before our eyes. Here’s a five-year chart of silver:
Blow-off top anybody? Here’s a long term chart of gold:
It seems like I’ve seen a ten year chart like that somewhere before…hmm, let’s see what the Nasdaq looked like as it headed into its blow-off top in the year 2000:
How did the Nasdaq perform over the subsequent couple years from that top, say from 2000 to 2003:
Everywhere I went in the late 1990s, people would ask me about tech stocks. Nowadays, whether I’m on a panel or whether I’m talking to the lady at the local print shop who’s helping me design my new business cards or whether I’m at lunch with my 72-year old retired high school senior English teacher, the first question out of anybody’s mouth when we talk investments is: “What do you think of gold?”
These recent dislocations in the silver market are very likely to spill over to the gold market, and I do believe we could see some 3, 5, or even 10% dislocations to the downside in both of these metals in coming weeks. More importantly, over coming months and quarters, we could see these commodities that people own sold off even as people suffer inflation, perhaps hyperinflation, in the commodities that people consume, such as cotton, sugar, corn, and perhaps even oil has upside from here in coming quarters and years.
This action in silver and already in gold soon also reminds me of oil in 2008, as it went parabolic into a huge blow-off top to $147 with huge dislocations to the upside, up from $30 a barrel just a handful of years earlier. Back as oil went into that parabolic dislocation action, I got very bearish on the commodity. In fact, I actually bet Donald Trump Jr that oil would see the $30s before it would see $150s as I hosted a nationally-televised two-hour block party on Wall Street in July 2008, as oil was at $130 on its way to $147 before falling all the way to $32 in the ensuing months. The bet? Each of our respective inheritance against each other’s. True story.
Somehow I don’t think I’ll ever get paid on that bet…and I don’t think I’d want the Trump assets and debts that come with them anyway. But let’s try to get paid on this gold and silver break down this time around.


