Better buys this time: Where I’d buy more of each of our positions

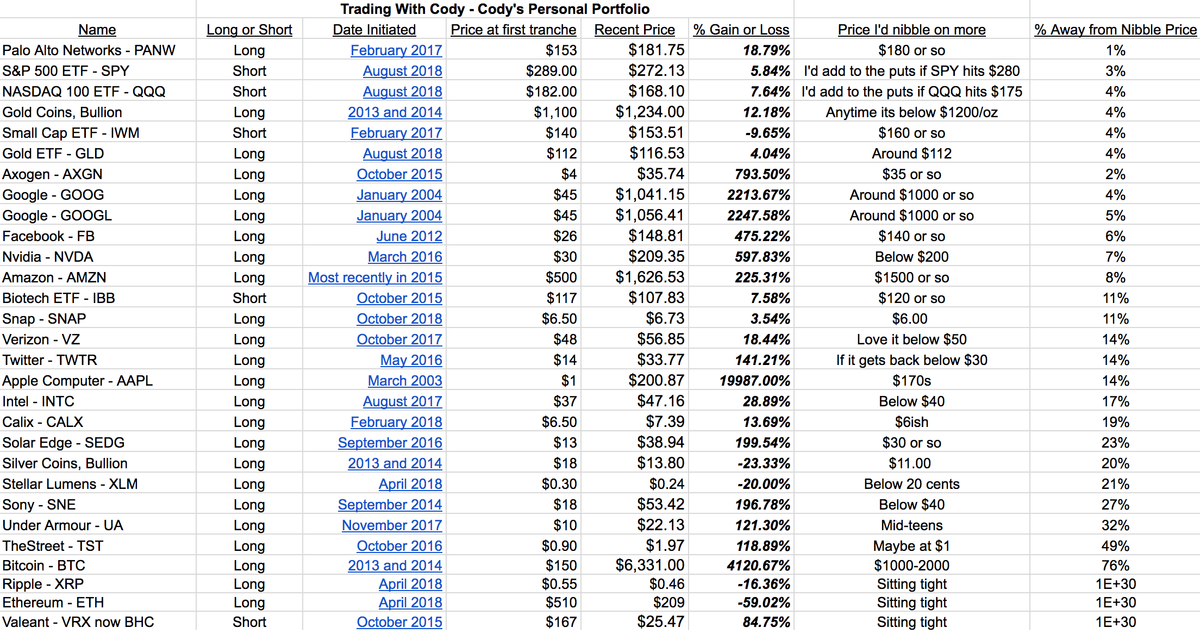
Here’s an updated list of all my positions including where I’d buy more of each of them. In fact, what I’ve done is put them in order of how close they are to where I’d buy more. You’ll see that there’s several stocks that are within about 5% of where I’d like to buy more of them and that I’d also be looking to add to our index put hedges if they rally another 2-3% from here. I’ve put the list in order of closest to my nibble price.
One thing I found interesting as I was updating this list over the weekend is underscored by a comment in the chat room last Monday right when Nvidia had fallen a full 30% from where we’d just recently trimmed some of our shares (shares that we’d bought at $30). Monday afternoon, as the markets were at their lows and NVDA hit $185 a share when someone noted:
“When asked where you expect $NVDA to be by year end, you answered $200. At that time (and even few months after that when it was cruising past $250), I felt its never gonna happen. Kudos to your analysis.”
The last time I sent out this “Where I’d buy more” list almost of our long positions were a rather bearish 20-30% away from where I’d was looking to buy more of them. In the list you’ll see below this time, many of them are less than 10% away from where I’d be looking to buy more.
But what’s really surprising is the that if you’d happened to put in GTC (good-til-canceled) orders since late July when I’d sent out that list of where I was looking to buy more, you’d have been filled, including at least six that would have rather amazingly been filled Monday afternoon right near the lows! In fact, you would actually be up on nine out of eleven already:
GOOG fell 25% since July 30, hitting my price target to buy more at $999 on Monday (up 6% now)
AMZN fell 25% since July 30, hitting my price target to buy more at $1499 on Monday (up 11% already)
FB fell 30%, hitting my price target to buy more at $145 on Monday (up 3%)
NVDA fell 25%, hitting my price target to buy more at $199 on Monday (up 7% now)
TWTR fell 30%, hitting my price target to buy more at $30 (up 15%)
AXGN fell 35%, hitting my price target to buy more at $35 (up 5%)
INTC fell 10%, hitting my price target to buy more at $45 on Monday (up 5%)
PANW fell 25%, hitting my price target to buy more at $180 on Monday (up 2%)
UA fell 30%, hitting my price target to buy more at $16 (I’d written that I might buy it at “$15 or so” and it hit $15.95 at Monday’s lows, so you’d be up 35%)
SEDG fell 40%, hitting my price target to buy more at $45 (down 11%),
WDC fell 20%, hitting my price target to buy more at $65 (down 27%).
Those eleven trades break down to a 4.6% gain vs the stock markets being down more than 5% since late July.
All the above analysis goes back to why I always preach patience and slow money. It also underscores how extended all the valuations got to be and why I was trimming Apple and Amazon and other names plus buying QQQ index puts when the world was celebrating Apple’s and Amazon’s trillion dollar market caps.
Be careful out there, be slow. Look for opportunities and swing when the pitches are good. You’ve heard me say all this stuff a million times over the years and we’ve got some quantitative evidence of those rules today.
Here’s the list in the form of a spreadsheet and a screenshot:
| Trading With Cody – Cody’s Personal Portfolio | ||||||||||
| Name | Long or Short | Date Initiated | Price at first tranche | Recent Price | % Gain or Loss | Years held | Annualized gain/loss | Price I’d nibble on more | % Away from Nibble Price | |
| Palo Alto Networks – PANW | Long | February 2017 | $153 | $181.75 | 18.79% | 1.25 | 14.77% | $180 or so | $180.00 | 1% |
| S&P 500 ETF – SPY | Short | August 2018 | $289.00 | $272.13 | 5.84% | 0.25 | 25.47% | I’d add to the puts if SPY hits $280 | $280.00 | 3% |
| NASDAQ 100 ETF – QQQ | Short | August 2018 | $182.00 | $168.10 | 7.64% | 0.25 | 34.23% | I’d add to the puts if QQQ hits $175 | $175.00 | 4% |
| Gold Coins, Bullion | Long | 2013 and 2014 | $1,100 | $1,234.00 | 12.18% | 4.75 | 2.45% | Anytime its below $1200/oz | $1,190.00 | 4% |
| Small Cap ETF – IWM | Short | February 2017 | $140 | $153.51 | -9.65% | 1.25 | -7.80% | $160 or so | $160.00 | 4% |
| Gold ETF – GLD | Long | August 2018 | $112 | $116.53 | 4.04% | 0.25 | 17.19% | Around $112 | $112.00 | 4% |
| Axogen – AXGN | Long | October 2015 | $4 | $35.74 | 793.50% | 2.75 | 121.74% | $35 or so | $35.00 | 2% |
| Google – GOOG | Long | January 2004 | $45 | $1,041.15 | 2213.67% | 14.25 | 24.66% | Around $1000 or so | $1,000.00 | 4% |
| Google – GOOGL | Long | January 2004 | $45 | $1,056.41 | 2247.58% | 14.25 | 24.79% | Around $1000 or so | $1,000.00 | 5% |
| Facebook – FB | Long | June 2012 | $26 | $148.81 | 475.22% | 6.25 | 32.30% | $140 or so | $140.00 | 6% |
| Nvidia – NVDA | Long | March 2016 | $30 | $209.35 | 597.83% | 2.25 | 137.14% | Below $200 | $195.00 | 7% |
| Amazon – AMZN | Long | Most recently in 2015 | $500 | $1,626.53 | 225.31% | 3.25 | 43.76% | $1500 or so | $1,500.00 | 8% |
| Biotech ETF – IBB | Short | October 2015 | $117 | $107.83 | 7.58% | 2.75 | 2.69% | $120 or so | $120.00 | 11% |
| Snap – SNAP | Long | October 2018 | $6.50 | $6.73 | 3.54% | 0.25 | 14.92% | $6.00 | $6.00 | 11% |
| Verizon – VZ | Long | October 2017 | $48 | $56.85 | 18.44% | 0.75 | 25.31% | Love it below $50 | $49.00 | 14% |
| Twitter – TWTR | Long | May 2016 | $14 | $33.77 | 141.21% | 2.25 | 47.90% | If it gets back below $30 | $29.00 | 14% |
| Apple Computer – AAPL | Long | March 2003 | $1 | $200.87 | 19987.00% | 15.25 | 41.58% | $170s | $172.00 | 14% |
| Intel – INTC | Long | August 2017 | $37 | $47.16 | 28.89% | 1.25 | 22.51% | Below $40 | $39.00 | 17% |
| Calix – CALX | Long | February 2018 | $6.50 | $7.39 | 13.69% | 0.5 | 29.26% | $6ish | $6.00 | 19% |
| Solar Edge – SEDG | Long | September 2016 | $13 | $38.94 | 199.54% | 1.75 | 87.18% | $30 or so | $30.00 | 23% |
| Silver Coins, Bullion | Long | 2013 and 2014 | $18 | $13.80 | -23.33% | 4.75 | -5.44% | $11.00 | $11.00 | 20% |
| Stellar Lumens – XLM | Long | April 2018 | $0.30 | $0.24 | -20.00% | 0.35 | -47.14% | Below 20 cents | $0.19 | 21% |
| Sony – SNE | Long | September 2014 | $18 | $53.42 | 196.78% | 4.25 | 29.17% | Below $40 | $39.00 | 27% |
| Under Armour – UA | Long | November 2017 | $10 | $22.13 | 121.30% | 0.7 | 211.05% | Mid-teens | $15.00 | 32% |
| TheStreet – TST | Long | October 2016 | $0.90 | $1.97 | 118.89% | 1.75 | 56.46% | Maybe at $1 | $1.00 | 49% |
| Bitcoin – BTC | Long | 2013 and 2014 | $150 | $6,331.00 | 4120.67% | 4.75 | 119.88% | $1000-2000 | $1,500.00 | 76% |
| Ripple – XRP | Long | April 2018 | $0.55 | $0.46 | -16.36% | 0.25 | -51.07% | Sitting tight | $0.35 | 1E+30 |
| Ethereum – ETH | Long | April 2018 | $510 | $209 | -59.02% | 0.25 | -97.18% | Sitting tight | 100 | 1E+30 |
| Valeant – VRX now BHC | Short | October 2015 | $167 | $25.47 | 84.75% | 2.75 | 25.01% | Sitting tight | $100.00 | 1E+30 |

** NOTE FOR NEW SUBSCRIBERS:
If you’re new to TradingWithCody or if you’ve been a subscriber for a while but haven’t acted on much of my strategies yet and/or if you haven’t been in the markets, but you’re sick of getting 0% on your CDs, Treasuries, savings, checking, etc while the markets have been continually hitting all-time highs this year, what should you do now?
Before you ever make any trade, step back and catch your breath before moving any money anywhere. Rank your positions and your whole portfolio and make sure you’re not about to make any emotional moves with your money.
If you haven’t yet read “Everything You Need to Know About Investing” then spend a couple hours doing so, please. It’s a quick read but chock-full of important ideas, concepts and strategies that amateurs and pros alike should understand.
Then, take a look at my own personal portfolio’s Latest Positions and slowly start to scale into some of the ones you like best and/or the ones I have rated highest right now. I’d look to start scaling into a few of the many stocks in the Latest Positions that are at all-time highs along with a couple that we’ve recently featured in our Trade Alerts that I’ve personally been scaling into.
You can find an archive of Trade Alerts here.


