End of quarter rhyming? And some facts on Central Bank gold buying

Sometimes I rhyme slow sometimes I rhyme quick
I’m sweeter and thicker than a chico stick
Here’s an ice cream cone honey take a lick
I go to Bay Plaza and catch a flick
Wore my Timberland boots so I can stomp ticks – Nice & Smooth
Remember when I wrote this about how the markets were likely to pop and rally hard right on the first of the year this year?
“My feet-to-fire near-term market analysis isn’t nearly so bearish. You often see me use sentiment as my primary near-term markets driver and when sentiment gets extremely bullish or extremely bearish in one direction or the other, I’ll try to take the other side. At other times, especially in today’s markets, it’s politics and propaganda that often drive the near-term and the sentiment that they drive can often further feed on the direction of the markets.
My point is this — do you guys remember the worries that everybody had last year about taxes rising? Do you realize that despite the incessant pounding of the panic drum by the mainstream media over this year’s fiscal-cliff negotiations that we went through the same damn thing last year?
And do you remember how despite the mainstream media’s obsession over the same issues peaking at about the same time last year, do you remember how the markets traded to kick off the year?
Last year’s big rally literally started on December 28, 2012, as the forces of panicky headlines and tax-avoidance selling were theoretically the primary near-term drivers of the markets.
That means, we probably need to already stop with the near-term bearishness I wrote about at the top of the markets last week and start to get ready for a potential, if obvious, pop in the new year. This sure ain’t scientific and that’s why I call it a “Feet-to-fire” analysis, but as Mark Twain told us, “History doesn’t repeat itself, but it does rhyme.”
Wouldn’t shock if me the end of the quarter or just a day or two off there, this market puts in a short-term top. That would mean this Friday or thereabouts would be the near-term top, if the rhyming continues.
Nice & Smooth – Sometimes I Rhyme Slow
Here’s something to think about that fits into my thesis of buying gold coins and bullion in the meantime:
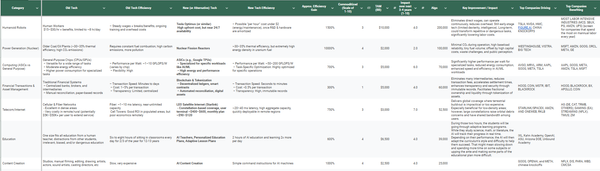
The following table lists the countries that have added to their gold reserves this year, while the second one tallies those that have been selling. You’ll see how recently each country has reported, along with its percentage increase.
|
Changes in Central Bank Gold Reserves in 2012 (Million Troy Ounces)
|
|||||
|
Year-End 2011
|
YTD 2012
|
Last Reported
|
Net Change
|
Percent Change
|
|
| Countries Increasing Reserves | |||||
| Turkey |
6.28
|
11.56
|
Dec
|
5.283
|
84.1%
|
| Russia |
28.39
|
30.79
|
Dec
|
2.405
|
8.5%
|
| Bank for International Settlements |
15.6
|
16.71
|
Dec
|
1.114
|
7.1%
|
| Brazil |
1.08
|
2.16
|
Dec
|
1.08
|
100.0%
|
| Philippines |
5.12
|
6.2
|
Nov
|
1.079
|
21.1%
|
| Kazakhstan |
2.64
|
3.71
|
Dec
|
1.07
|
40.5%
|
| South Korea |
1.75
|
2.71
|
Nov
|
0.965
|
54.9%
|
| Iraq |
0.19
|
0.96
|
Nov
|
0.773
|
405.3%
|
| México |
3.41
|
4
|
Dec
|
0.596
|
17.3%
|
| Paraguay |
0.021
|
0.263
|
Sept
|
0.242
|
1152.4%
|
| Ukraine |
0.9
|
1.14
|
Dec
|
0.239
|
26.7%
|
| Belarus |
1.21
|
1.37
|
Dec
|
0.164
|
13.2%
|
| Tajikistan |
0.15
|
0.2
|
Dec
|
0.05
|
33.3%
|
| Brunei |
0.06
|
0.09
|
Oct
|
0.031
|
50.0%
|
| Mozambique |
0.08
|
0.11
|
Oct
|
0.025
|
37.5%
|
| Serbia |
0.46
|
0.48
|
Nov
|
0.022
|
4.3%
|
| Jordan |
0.41
|
0.43
|
May
|
0.02
|
4.9%
|
| Kyrgyz Republic |
0.08
|
0.1
|
Dec
|
0.014
|
25.0%
|
| Greece |
3.59
|
3.6
|
Dec
|
0.008
|
0.3%
|
| Mongolia |
0.11
|
0.12
|
Nov
|
0.004
|
9.1%
|
| Suriname |
0.071
|
0.074
|
Dec
|
0.003
|
4.2%
|
| South Africa |
4.02
|
4.02
|
Nov
|
0.003
|
0.0%
|
| Moldova |
0
|
0.002
|
Dec
|
0.002
|
|
| Bulgaria |
1.28
|
1.28
|
Dec
|
0.001
|
0.0%
|
| Pakistan |
2.071
|
2.072
|
Dec
|
0.001
|
0.0%
|
| Subtotal Gross Increases |
15.2
|
||||
|
Changes in Central Bank Gold Reserves in 2012 (Million Troy Ounces)
|
|||||
|
Year-End 2011
|
YTD 2012
|
Last Reported
|
Net Change
|
Percent Change
|
|
| Countries Decreasing Reserves | |||||
| Sri Lanka |
0.32
|
0.12
|
Sept
|
-0.204
|
-62.5%
|
| Germany |
109.19
|
109.04
|
Dec
|
-0.159
|
-0.1%
|
| Czech Republic |
0.4
|
0.37
|
Dec
|
-0.028
|
-7.5%
|
| Macedonia |
0.22
|
0.22
|
Dec
|
-0.001
|
0.0%
|
| France |
78.3
|
78.3
|
Dec
|
-0.001
|
0.0%
|
| Malta |
0.01
|
0.01
|
Dec
|
-0.001
|
0.0%
|
| Subtotal Gross Decreases |
-0.39
|
||||
|
|
|||||
| Total Net Change |
14.8
|
||||
| Sources: IMF, CPM Group. Data as of 1-31-13. | |||||
Based on current data, the net increase in central bank gold buying for 2012 was 14.8 million troy ounces – and that’s before the final 2012 figures are in for all countries.