Markets Commentary: Charts From The Dot-Com Crash Don’t Exist Anymore

I ran to Denver with my two daughters and wife for a check up on Amaris’ eye, leaving Sunday morning and getting back last night.
People were out everywhere, mostly all unmasked (for now). There’s no doubt that the reopening of the economy has been a boom for travel and entertainment businesses.
But I wonder how much of this current booming consumer economy is going to fade as people spend the last of their stimulus checks during this current boom. If ever there was a one-time catalyst for consumer spending, it’s the past year’s worth of stimulus and unemployment and other benefits that the government provided during the pandemic’s worst days.
The pandemic isn’t over yet as the Delta variant and a global lack of vaccines means hundreds of millions of people are likely to suffer through the Coronavirus crisis around the world in coming months. The Olympics in Japan are about to happen just as there’s a new wave hitting there. Few in the US seem concerned that the global economy is going to be weaker than expected this year and perhaps next year, even if the US economy and social interactions continue to improve towards and/or better than pre-pandemic levels.
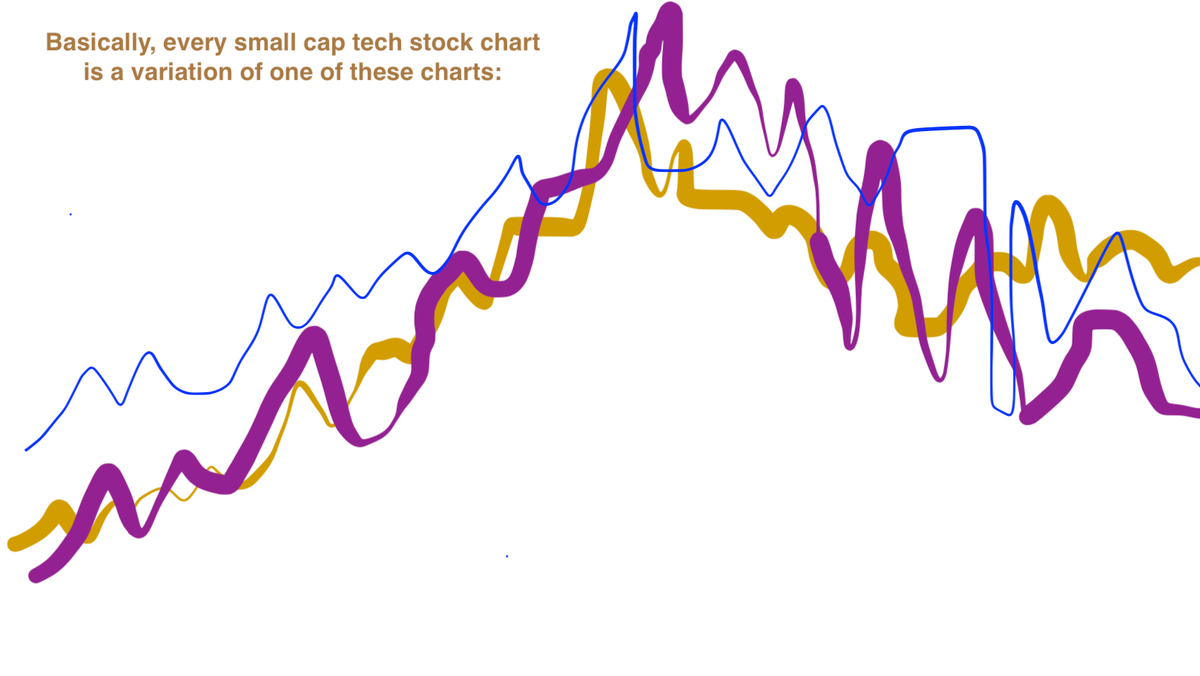
One of the things I did on the road was to run through charts of hundreds of stocks, just to confirm what I thought most one-year charts, especially in the small cap tech sector, look like:

Most small cap and lots of big cap tech charts look like they’ve finished doing a blow-off top back in February/March and have since been gyrating volatile-ishly but in a slow grind lower. The biggest question now for traders is whether these current levels are going to turn out to be support or resistance. If support, then most of these stocks will rally from here, some of which will retrace at least half of their recent 50-70% pullbacks. If resistance, then most of these stocks will have a good bit of room to fall further.
I was talking to an advisor of mine about this and I said out loud that I thought many of these charts remind me of the dot-com charts in 2000 when they had blown off topped in February/March and then made some dead cat bounces higher but eventually fell straight out of bed, with many of those stocks falling 80-100% (Webvan, Pets.com, Winstar, A123, etc). My friend went to pull up charts from those days, but I reminded him that all of the charts for the thousands of stocks that went to $0 before the markets eventually bottomed in 2002/2003 are no longer available. And those are the charts that are probably most relevant to today’s situation. Not that I think this market will crash quite like that one did in 2001-2002, but I do think we could be in for a slow grind lower towards $0 for hundreds of stocks that are currently being valued at billions of dollars or hundreds of millions of dollars, not to mention the crappy penny stock tiny caps that are valued in the tens of millions, many of which have recently joined the parabolic blow-off top parade.
Remember back in 1998 when KTLI popped 500% in one week after they announced they were going to start a website where you could buy KTEL records? I remember reading retail investors’ comments on message boards that would explain to any doubters that they just didn’t realize how big the online opportunity for record and music sales was going to turn out to be. What could go wrong by throwing a little bit of money in front of that kind of a train before it leaves the station by buying a much cheaper stock than Amazon, which was clearly already the leader in retailing stuff online? K-Tel doesn’t exist any more and the stock, went to $0.
And this time around, courtesy of how everybody decided that they should try to make the shorts scramble on the most heavily shorted names, which are of course usually the crappiest companies, it’s almost like every single chart of the worst companies out there has also gone parabolic and is still up huge from, well, $0. The worst stocks went up the most this year, and that’s yet another sign of the currently popping bubble.
Many stock charts that I looked at are down 30-40% in the last two or three weeks, as many of the names that were bought because they were getting included into one of the Russell Indexes are now being sold.
Look, most of our own portfolio isn’t small cap tech stocks. That said, we bought Apple when it was worth a few billion dollars. We bought Google when it was worth tens of billions. Same with Facebook. And Amazon. And Bitcoin was worth a couple billion dollars when we first bought it. These are worth trillions now. But few of the current batch of stocks worth <$10 billion look attractive to me right now.
Outside of The Space Revolution, which itself hasn’t even really started yet, I find most valuations out there, to be way too high to be attractive to me. I continue to work on a handful of new names in the AI sector that I’m trying to get comfortable with, but I’m not rushing things. I’m not willing to lose my discipline with our money. Today, and the last few weeks, have been a reminder to many people that stocks and cryptos can create pain. That pain leads to reaction, just as greed earlier led to action.
Be careful out there. Don’t force it. Be patient.