Trade Alert and complete technical analysis for Facebook

Did we just see a blow-off top in Facebook this morning as it spiked another 3% to the highest levels its been in months? The stock has since faded and is up less than 1% as I type this which certainly begs the question of whether that morning rally was a blow-off top for the stock.
A blow-off top happens when a stock that has been in a steady state of rally suddenly spikes and then fades back to lower lows for a while afterward. Here’s how Investopedia defines it:
A chart pattern that indicates a steep and rapid increase in a security’s price and trading volume followed by a steep and rapid drop in price and volume. The rapid changes indicated by a blow-off top, also called a blow-off move or exhaustion move, can be the result of actual news or pure speculation.
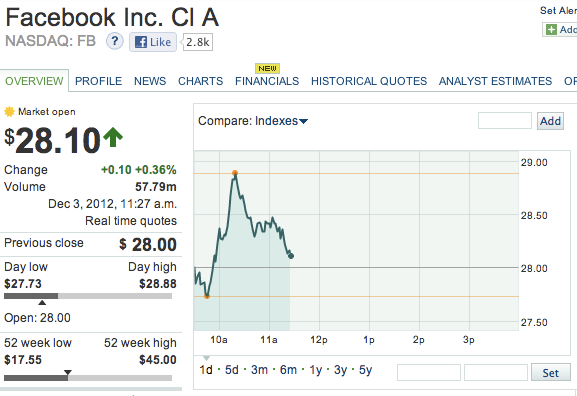
Here’s a chart of this morning’s action in FB:

Looks a lot like that sample of a “blow-off top” chart from the definition of it above, huh?
The 5-day FB chart is another example of a potential blow-off top chart:

But I think most chartists would agree that the 3-month chart looks a lot healthier and perhaps the intermediate term diagnosis from the FB chart isn’t all bad:

Hmm, notice in the time that I started this post at to the time I finished grabbing the above charts, that FB continued to fade in a classic blow-off top kind of action, as it eventually even turned negative after that 3% initial spike this morning.
I don’t ever trade off of this kind of technical analysis, but I do think there are times that these kind of so-called charting technicals can drive a stock’s movement for a time, especially in between the quarterly earnings reports, as we are now. And for whatever reason, it sure looks like the guys who trade from charts and the programs they’ve created with their trading algorithms have caught hold of FB for now. (If you don’t think the fundamentals and spotting true revolutionary companies vs. the poseurs matter at all, then how to explain the LinkedIn LNKD and Facebook contingent of social/app IPOs being able to keep value vs. the Groupon GRPN Zynga ZNGA and Pandora P contingent? Note that Yelp YELP and Zillow Z contingent are likely somewhere rightly in the middle of those two extreme contingents as they are doing okay fundamentally and their stocks entirely crashed either.)
So feet to fire, what’s all this technical and charting analysis mean? As usual, it depends on your time frame. If you’re a day trader or looking to make a quick buck before next week, the charts say the stock is headed lower, so trade accordingly. If you’re trying to game the stock into year-end, I’d probably consider shorting the stock or buying near-term puts and then cover/sell those if the blow-off top fade continues to play out over the next few days and even look to see if you can get some December calls on the sheets if the stock falls below $27 again.
And if you’re more like me, someone who’s driven by fundamental and revolutionary trends analysis and is therefore bullish on the stock for the next couple years at least? Well, as per our playbook, I preferred to do my FB trading by buying using my tranche-scaling method with both common stock and call options in FB, the last time it was utterly hated and the chart looked absolutely horrible. In this case, as you guys know, I’d been buying the day before the lock-up expiration when panic and bearishness over this overly hyped new shares on the market issue were peaking.
All of the call options from that and the other FB trades are now up big, anywhere from 50% to some that are tripled or more. Instead of trying to mess around with the charting and the technical analysis with everybody else, I’m going to continue trimming some of those call options while the stock is up more than 50% in a straight line.
I’ve still got lots of upside exposure in my FB common stock and the FB calls that I’ll continue to hold for now. I’ll be holding onto my longest-dated and highest-strike price call options which range from June $22s to January 2014 $32s. I’ll be gently and steadily continuing to trim my March $22 calls first and then move onto the Junes and probably hold all of the January 2014s.
No other trades for me yet today.